Supply/demand planning automation
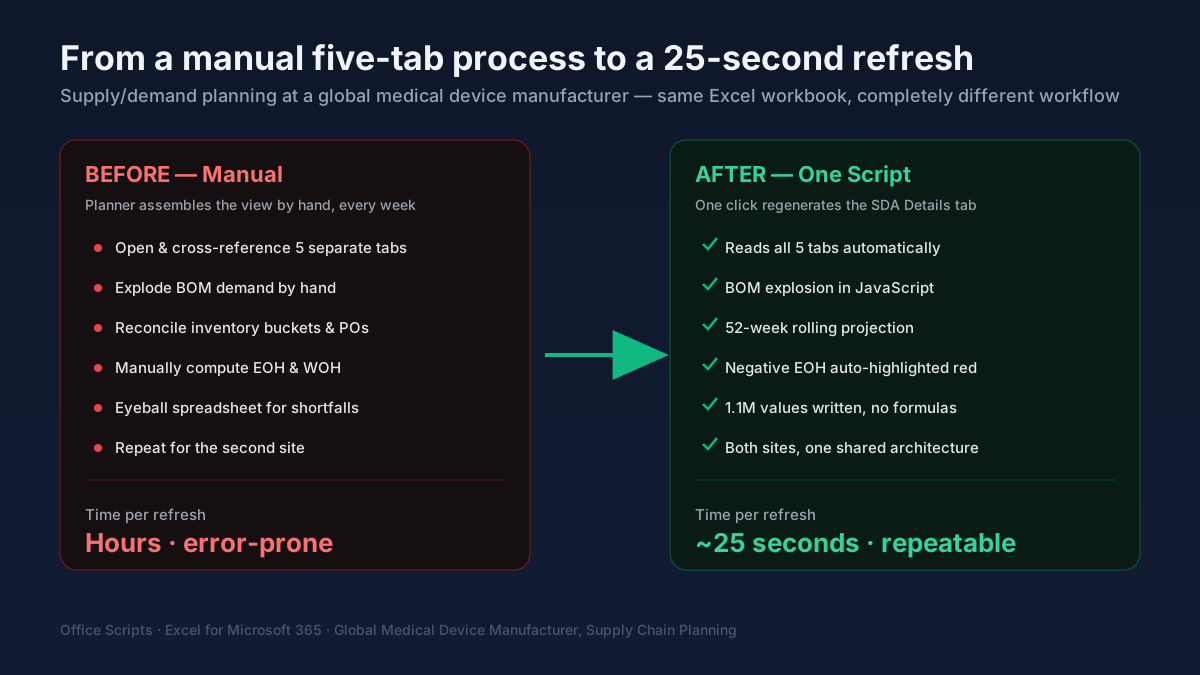
A supply planning team at a global medical device manufacturer was manually cross-referencing five Excel sources every week to track ~1,800 components against a 52-week demand horizon. We replaced it with an Office Scripts automation that explodes BOM demand and refreshes the full supply/demand picture in about 25 seconds.
The Context
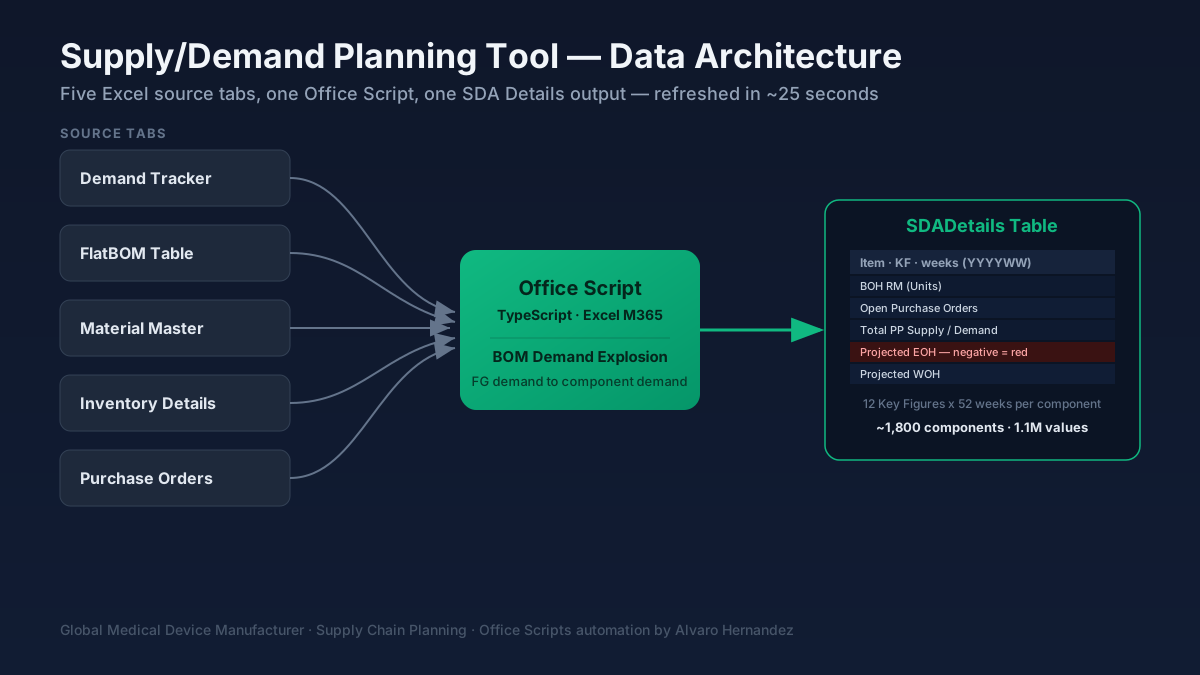
A supply planning team inside a global medical device manufacturer needed a weekly, component-level view of supply versus demand across a 52-week horizon, for two manufacturing sites and roughly 1,800 unique components. The existing process required planners to manually cross-reference five separate data sources — a demand forecast, a Bill of Materials, a Material Master, an inventory snapshot, and open purchase orders — with no automated explosion from finished-good demand down to component demand, no consolidated view, and no signal for which components were at risk of running negative. The team worked entirely inside Excel and Microsoft 365; no new infrastructure was on the table, so the fix had to live inside the existing workbook as an Office Script.
The Solution
We designed and built two Office Scripts — one per manufacturing site, sharing identical architecture — that replace the entire manual assembly process end to end.
BOM demand explosion in JavaScript
The script reads finished-good demand from the Demand Tracker, multiplies it by BOM quantity for each component parent, and aggregates component-level demand across every finished-good parent — covering roughly 1,800 components per site.
Beat the Office Scripts timeout
Writing formula strings for 1.1 million cells (1,800 components × 12 rows × 52 weeks) hits Excel's 5-minute Office Scripts timeout regardless of batch size. We pre-compute every value in JavaScript and write it in batched calls — around 10x faster, since Excel skips formula parsing entirely.
Rolling 52-week projection
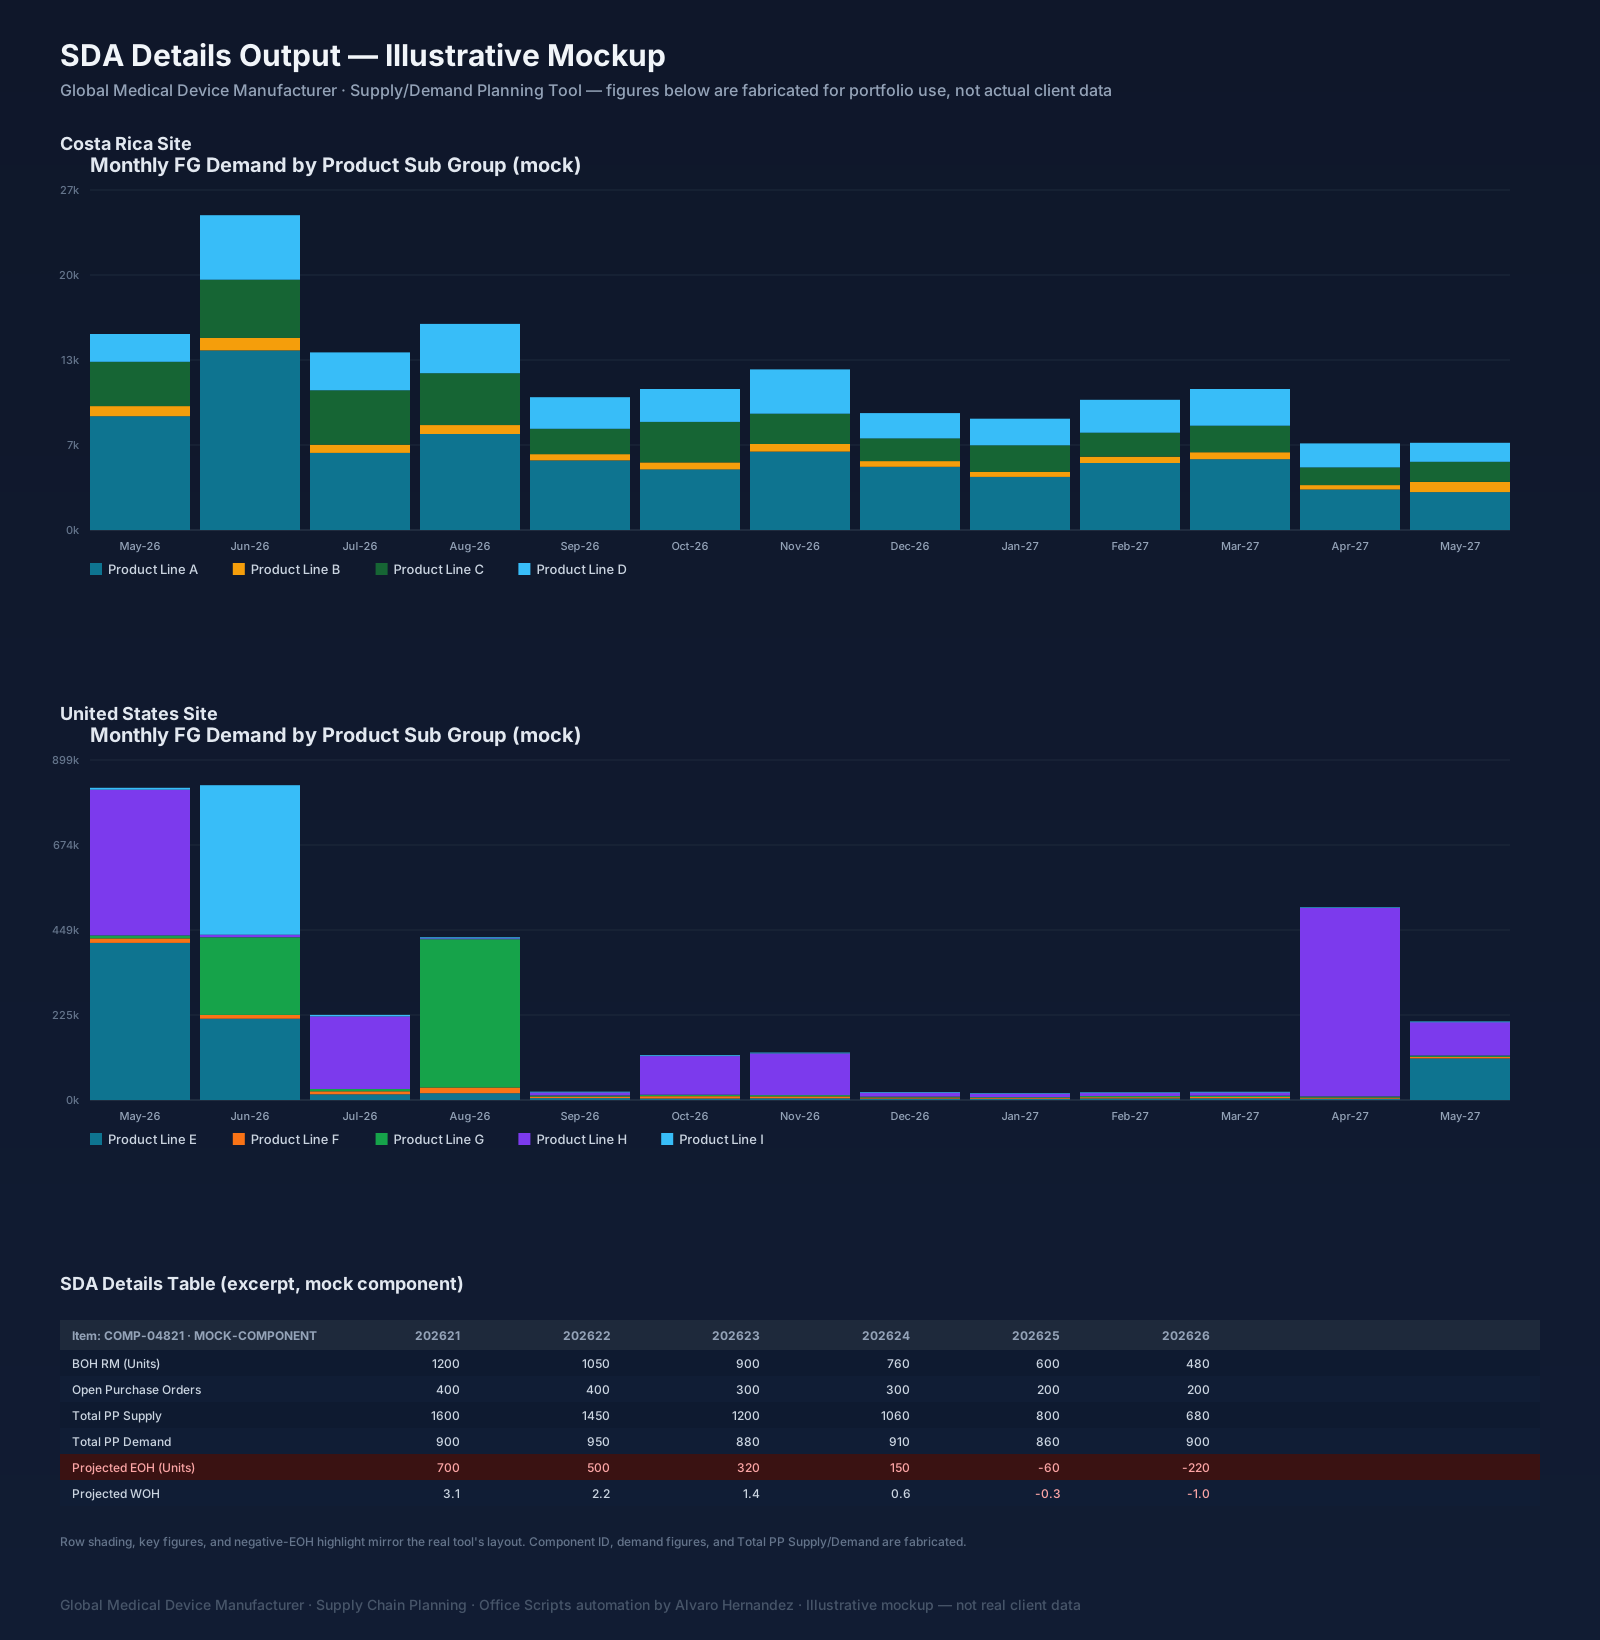
A 12-row key-figure structure per component — inventory on hand by bucket, open POs, supply adjustments, total supply and demand, projected end-of-hand in units and dollars, freight cost, and weeks on hand — computed as a rolling projection, where each week's closing balance becomes the next week's opening balance.
One conditional format instead of 1,800
A single formula-based conditional format applied across the entire week-data range highlights every negative projected end-of-hand cell in red, without applying a separate rule per component.
Resilient to source-data drift
Flexible column detection on the Material Master handles both direct exports and SharePoint list exports, which silently rename columns (SKU to Title, Cost to Material Cost) — a mismatch that had previously caused Material Master data to drop out with no error.
The Results
The weekly manual assembly is gone. Planners run one script and get a full component-level supply/demand picture in about 25 seconds, with at-risk components already flagged in red.